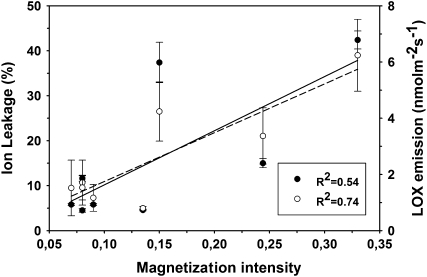
Figure 5.
Plot of the magnetization intensity calculated at a time of 40 ms on the best fit of CPMG decays and of LOX product emissions (black circles) and of ion leakage (white circles) in control leaves of black poplar and in leaves exposed to dehydration or to osmotic stress for up to 24 h after stress initiation. Means ± se (n = 3) are shown. Best fits and linear regressions (dashed line = ion leakage, solid line = LOX products emission) were calculated with Sigma Plot 9.0 software.

