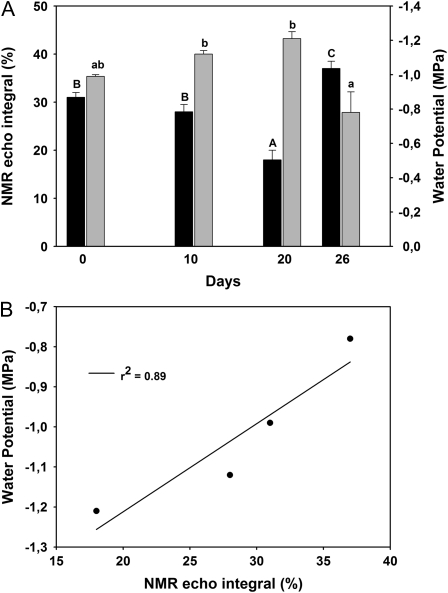
Figure 7.
A, NMR echo integral (black bars) and leaf water potential (gray bars) during a slowly developing water stress and during recovery from stress (day 26) in black poplar leaves. Means ± se (n = 3) are shown. Differences between means of NMR echo integral and leaf water potential over the time course of the experiment were separated by ANOVA and Tukey's test. Differences at P < 0.01 and 0.10 are represented by different single and double letters, respectively. B, The two indices are plotted against each other to better illustrate the relationship observed during the entire experiment.

