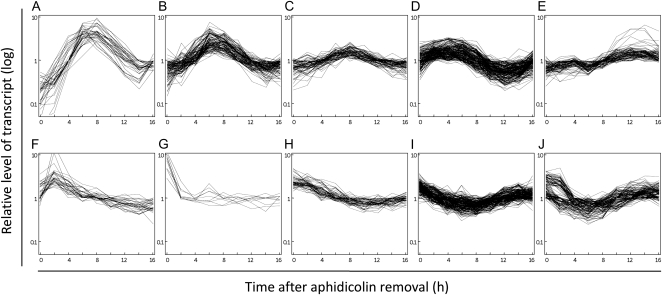
Figure 2.
Classification of cell cycle-regulated transcripts in synchronous cultures of BY-2 cells. Synchronization of BY-2 cells was performed twice independently in experiments A and B. In each experiment, cells were sampled at 2-h intervals after release from an aphidicolin block, and the total RNA extracted from each sample was used for microarray analysis. Among 16,896 ESTs in the microarray, 3,846 ESTs showed more than a 2-fold variation in transcript levels during the culture period in both experiments. These ESTs were further analyzed by self-organizing map clustering using data sets of the two independent experiments as described in “Materials and Methods.” These analyses yielded 883 cell cycle-regulated transcripts that were classified into 10 classes (A–J). The expression pattern of each transcript in experiment A is shown separately for each class. Similar expression profiles in each class were obtained in experiment B (data not shown). In each graph, the time points in the synchronous cultures are indicated in hours on the x axis and the median polishing-normalized relative expression levels are shown on the y axis in logarithmic scale.

