Figure 3.
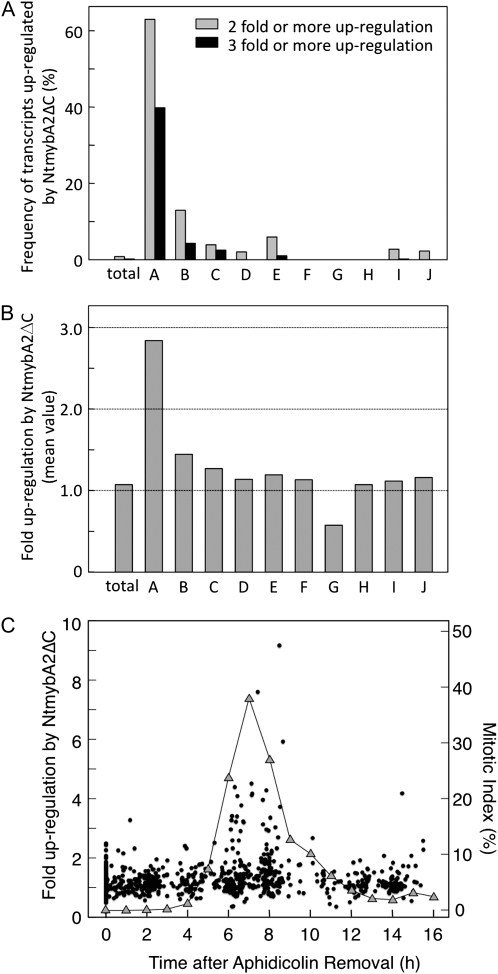
M phase-specific classes of transcripts are preferentially and strongly up-regulated by NtmybA2ΔC overexpression. A, Frequency of the transcripts up-regulated by NtmybA2ΔC in each class. For each transcript, the ratio of the expression signal in 35S∷NtmybA2ΔC cells to that in control cells is averaged over three independent experiments. Frequencies of transcripts with this average expression ratio being more than 2 (gray bars) or 3 (black bars) are shown for each class (A–J). The frequency of such transcripts is also calculated in the total transcripts of the microarray (total). B, Magnitude of up-regulation by NtmybA2ΔC overexpression in each class. The expression ratio between the 35S∷NtmybA2ΔC and control cells for each transcript is averaged for each class (A–J). The averaged expression ratio is also calculated in the total transcripts of the microarray (total). C, Scatterplot showing correlation between the time of peak expression and the magnitude of up-regulation by 35S∷NtmybA2ΔC. For each cell cycle-regulated transcript, the expression ratio between 35S∷NtmybA2ΔC and control cells is plotted against the time of peak expression estimated from the expression data in synchronous cultures as described in “Materials and Methods” (black dots). The mitotic index for each time point is also plotted (gray triangles) for comparison.

