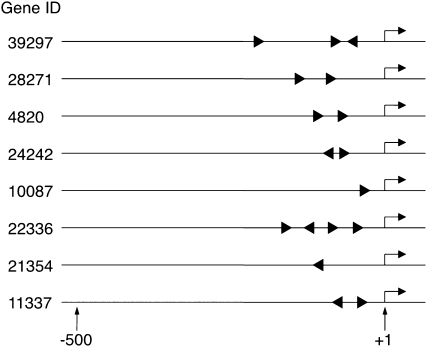
Figure 4.
Positions and orientations of MSA-like motifs in upstream regions of the genes up-regulated by NtmybA2ΔC. Each line shows the promoter region of the gene represented by a Gene ID, where arrows above the lines indicate transcriptional start sites. Numbers below the lines show nucleotide positions relative to transcriptional start sites (+1).

