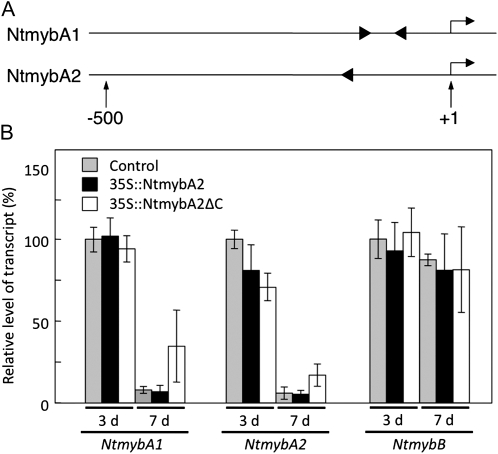
Figure 7.
Possible autoregulation of NtmybA2. A, Positions and orientations of the MSA-like motifs in the upstream regions of NtmybA1 and NtmybA2. Arrows above the lines indicate transcriptional start sites; numbers below the lines show the nucleotide positions relative to the transcriptional start sites (+1). B, Up-regulation of NtmybA1 and NtmybA2 genes in the 35S∷NtmybA2ΔC cells. The transgenic BY-2 cells carrying the vector alone (Control), 35S∷NtmybA2, and 35S∷NtmybA2ΔC were sampled on day 3 (logarithmic phase) and day 7 (stationary phase) after subculture. Total RNA was extracted from each sample, and real-time RT-PCR analysis was performed to quantify the transcript abundance of NtmybA1, NtmybA2, and NtmybB. The results of real-time PCR analysis are shown after normalization to EF1α mRNA expression. The relative transcript levels were averaged over the three biological replicates and are shown with the sds (error bars).

