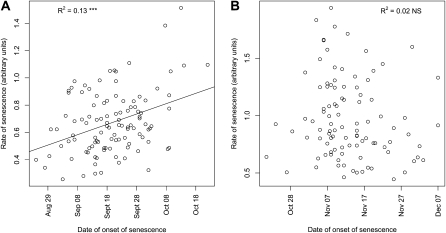
Figure 3.
Relationships between the date of onset and the rate of senescence in greenhouses under natural (A) and controlled (B) photoperiods. NS, Not significant; R2, squared Pearson correlation coefficients for the relationship between trait and latitude of origin. ***, Statistically significant at P < 0.001.

