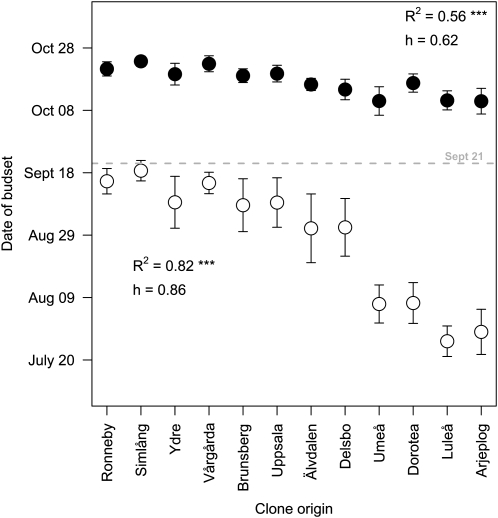
Figure 4.
Relationships between clone origins (ranked from south to north) and date of bud set in the SwAsp collection grown in greenhouses under natural (white circles) and controlled (black circles) photoperiods. The dotted line indicates when the additional light was turned off in the controlled-photoperiod experiment (on September 21). Values are means ± sd of six to 10 clones per location. h, Repeatability within populations; R2, squared Pearson correlation coefficients for the relationship between trait and latitude of origin. ***, Statistically significant at P < 0.001.

