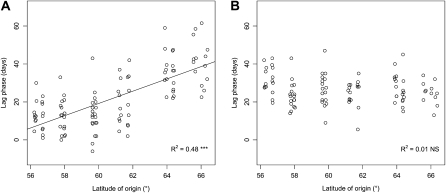
Figure 5.
Relationship between latitude of origin and lag phase between bud set and start of senescence in the SwAsp collection grown in greenhouses under natural (A) and controlled (B) photoperiods. NS, Not significant; R2, squared Pearson correlation coefficients for the relationship between trait and latitude of origin. ***, Statistically significant at P < 0.001.

