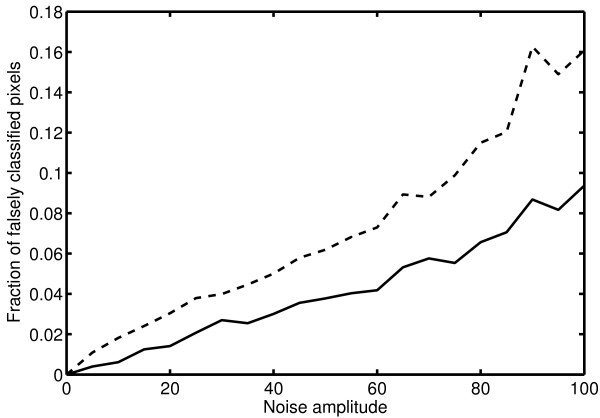
Figure 7.
Sensitivity to noise. The fraction of falsely classified pixels for images with different levels of added uniform random noise, compared to the edge map computed for the original image in figure 5a. Results are shown for our curvelet-based scheme (solid line) and for the Canny edge detector (dashed line). The analysis parameters were kept the same for all images.

