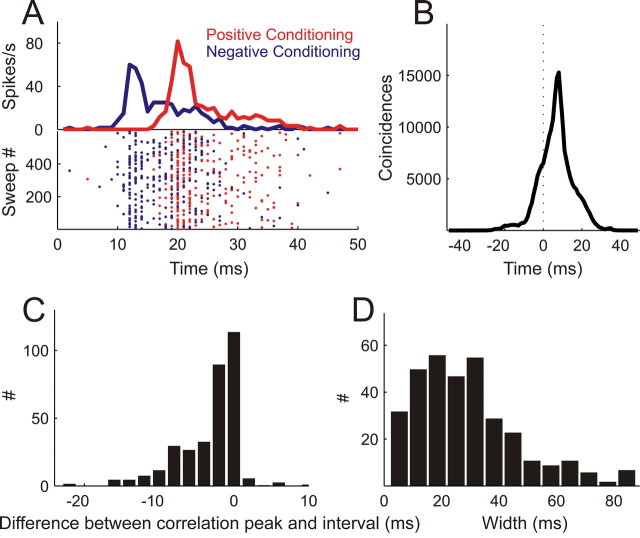
Figure 3.
Spike timing precision of conditioning responses. A, Raster plots (bottom) and PSTHs (top) of action potentials fired during 600 pairs of positive (NPF preceding PF, red) and 600 pairs of negative conditioning (PF preceding NPF, blue) with an 8 ms interval. B, Cross-correlating the spike trains from positive and negative conditioning shown in A resulted in a cross-correlation function with a peak at 8 ms and a width at half-maximum of 10 ms. C, The majority of cross-correlation functions (n = 339) exhibit peak positions coinciding with the interval between the stimuli in the conditioning pair. Results are normalized so that a value of 0 means that the peak position of the cross-correlation function was equal to the interval and negative values indicate that the peak position was closer to 0 ms than expected from the interval used. D, Distribution of widths of cross-correlation functions across the population of units in this study.

