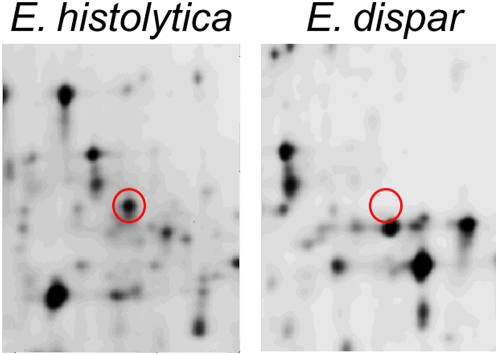
Figure 4. The gel area and spot representing ADH3 from one representative DIGE gel.
The right panel is a fluorescent intensity scan of E. histolytica; the identical region from E. dispar is on the left. The outlined spot was identified as ADH3 by mass spectrometry. The demarcated region was used to calculate the signal fold difference between the species' ADH3 protein abundance, which was 5.82-fold higher in E. histolytica than E. dispar in this gel.

