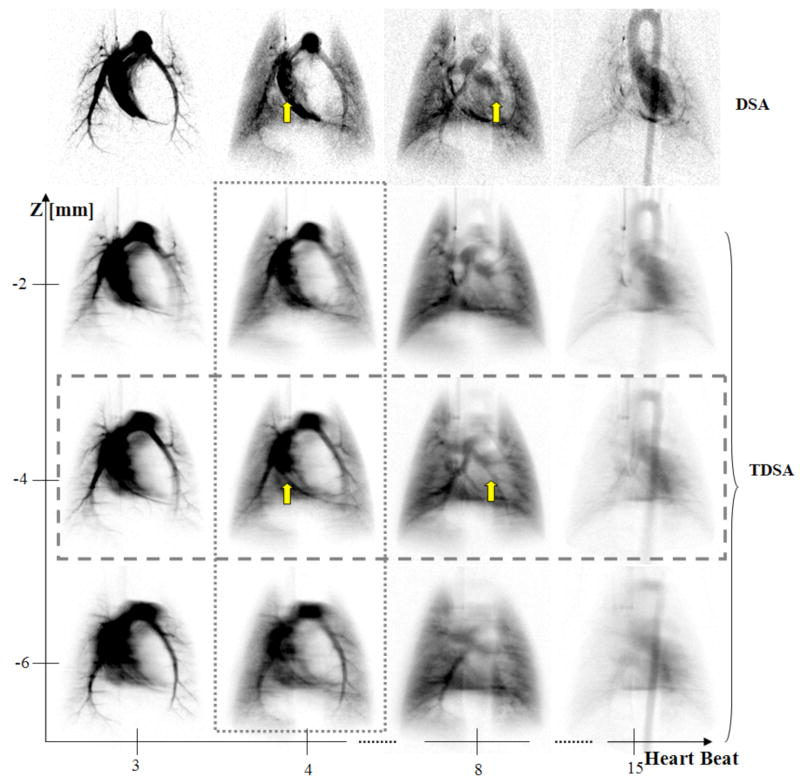
Figure 12.
A comparison at four selected heartbeats post-contrast injection i.e. (3rd, 4th, 8th, 15th) between DSA and three TDSA planes at 2 mm interval on z axis. A 40° arc was used for TDSA sampling. Note how the depth discrimination reveals the pulmonary vessels (arrows) at z = −4 mm TDSA slice. These vessels are masked by the superposition of other structures, such as the right or left ventricle in the DSA sequence. TDSA allows 4D imaging i.e. both time evolution at heartbeat resolution (horizontal rectangle) and depth discrimination (vertical rectangle). [reproduced with permission from Badea et al.(Badea et al., 2007a)]

