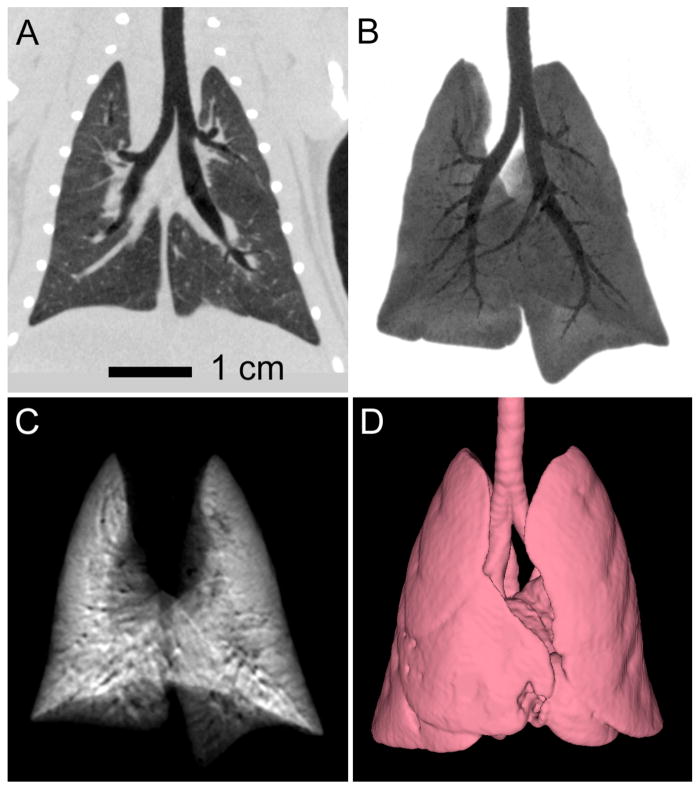
Figure 5.
Example data from in vivo xenon-enhanced contrast imaging of the rat lung. Breath-hold 3D CT image acquisition (8s scans with 0.152 mm isotropic spacing) provides both multi-planar reformatted (A) and minimum intensity projection (B) images of the air-filled lung, as well as images derived from subtraction of xenon-filled and air-filled lung images, illustrated by the maximum intensity projection in (C). Isotropic spatial resolution, combined with rapid breath-hold scanning facilitates automated segmentation of the lung and airway boundaries (D). Images courtesy of Dr. Giles Santyr, Robarts Research Institute, University of Western Ontario.

