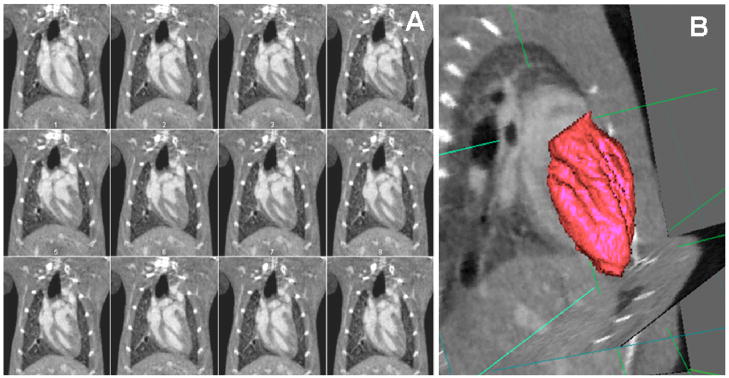
Figure 6.
(A) Micro-CT images in the coronal orientation during 12 time points in the cardiac cycle (temporal resolution 10 ms). The spatial resolution is 0.1 mm and isotropic. (B) The 4D data is visualized and can be analyzed with semi-automatic tools (Badea et al., 2008b) to segment and measure the volume of blood in the left ventricle, based on which the cardiac function measures such as ejection fraction, stroke volume and cardiac output can be computed.

