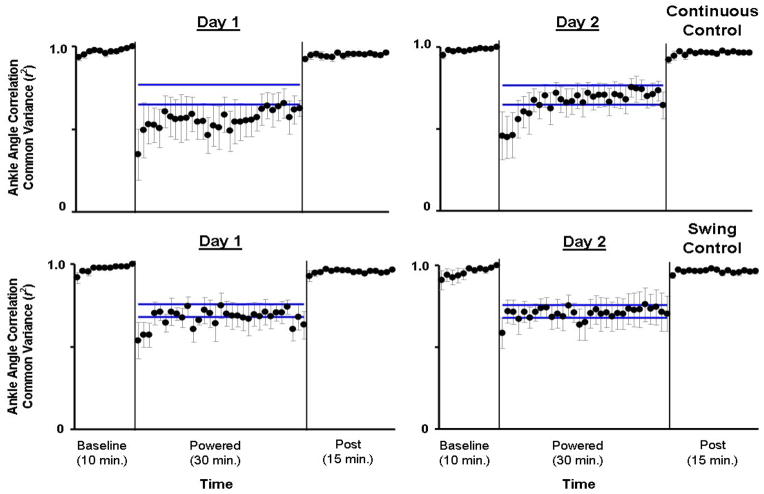
Fig 3.
Ankle joint angle correlation common variance (r2). Mean data (black dots) ± 1 standard error of mean (grey bar) are shown for each minute. The two horizontal blue lines are the mean ± 2 standard deviations from the last 15 minutes of active condition on day 2, representing steady state dynamics. The steady state envelopes shown above from the averaged group data are for display purposes. Steady state dynamics were determined for each subject, individually. Ankle joint angle correlation common variance (r2) increased with practice in the active condition. However, by the end of active condition on Day 2 (Day 2, minute 30), the values of ankle joint angle correlation common variance in both groups were still significantly different from baseline (mean±SD: Continuous Control: 0.64±0.19, Swing Control: 0.70±0.24, THSD, p<0.05).

