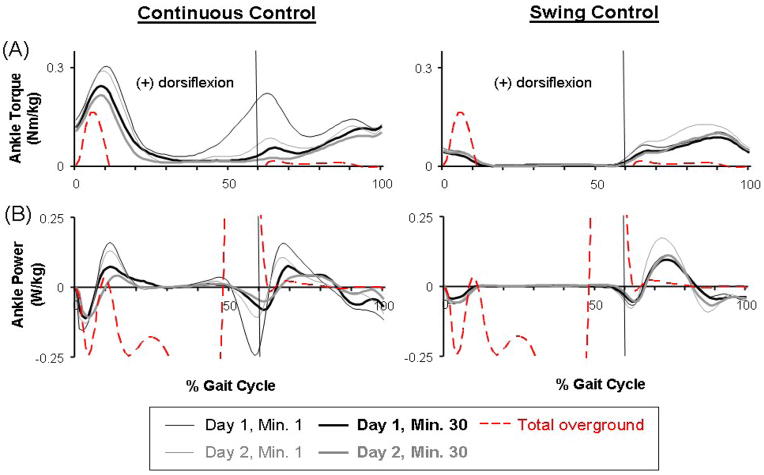
Fig 4.
Mechanics of the powered orthosis. (A) Dorsiflexor torque provided by the orthosis. These averaged data (black and grey lines) from all subjects of each group represent only the portion of ankle torque produced by the orthosis (calculated from artificial muscle force and muscle moment arm) during active condition (the first and last minute on both days). Average ankle torque (red dashed line) during overground walking with no orthosis was calculated from inverse dynamics. The overground walking data shown above is zoomed in to the similar range of the powered orthosis data due to relatively small dorsiflexor torque production during normal walking. (B) Dorsiflexor power provided by the orthosis. The positive value represents power generation and negative value represents power absorption. These averaged data (black and grey lines) from all subjects of each group represent only the portion of ankle power produced by the orthosis during active condition. Average ankle power (red dashed line) was calculated from inverse dynamics during overground walking with no orthosis.

