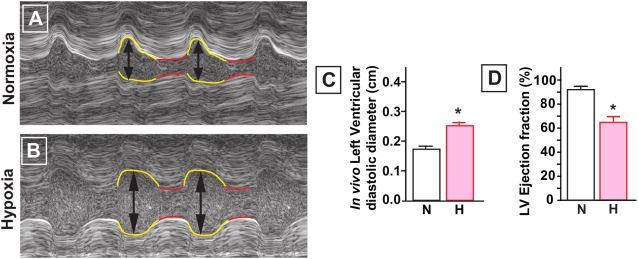
Figure 3. Echocardiography in E20 chick embryos.
A and B, M-mode echo of normoxic and hypoxic embryos showing diastolic LV dilatation (arrows). C, diastolic left ventricular diameter is larger in the hypoxic embryos. D, hypoxic embryos demonstrate lower ejection fraction. Data are shown as mean±SE; * P<0.05 Hypoxia versus Normoxia.

