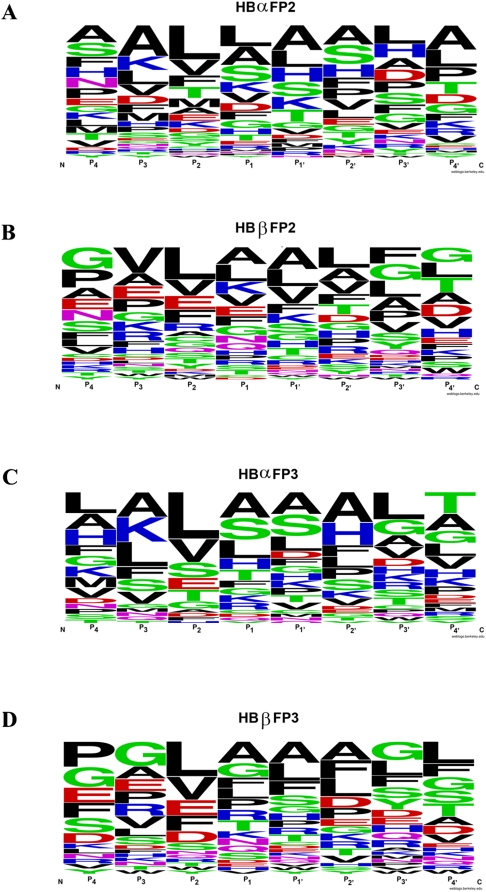
Figure 4. Cleavage site preferences for falcipain-2 and falcipain-3.
Preferences for amino acids (single letter code) at P1-P4 and P1′-P4′ are shown schematically. At each position, the height of each amino acid corresponds to its frequency at cleavage sites based on analysis of α and β globin. WebLogo (weblogo.berkeley.edu), a free software for plotting consensus sequences, was used to plot P4- P4′ preferences.

