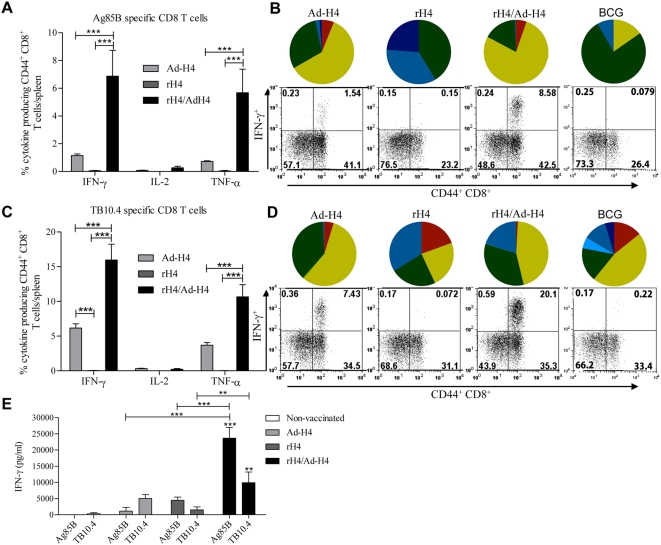
Figure 2. Cytokine frequencies and phenotypic profiles of specific CD8 T cells in Ad-H4, rH4, or rH4/Ad-H4 vaccinated mice one week after final vaccination.
CB6F1 mice were vaccinated once with Ad-H4, twice with rH4 in cationic liposomes, or once with rH4 in cationic liposomes followed two weeks later by one Ad-H4 vaccination. Mice were sacrificed one week after the final vaccination and splenocytes were stimulated with Ag85B or TB10.4 peptides prior to staining with anti-CD8, -CD44, -IFN-γ, -IL-2, and –TNF-α. (A and C) Frequencies represent IFN-γ, IL-2, or TNF-α producing CD44+CD8+ T cells out of total CD8 T cells specific for Ag85B (A) or TB10.4 (C). Background staining from cells stimulated with medium alone has been subtracted. Data represent the mean+SEM of a minimum of five mice per group with ***, p<0.001, **, p<0.01, and *, p<0.05 (2-way ANOVA with Bonferroni posttest). (B and D) IFN-γ, IL-2, and TNF-α cytokine profiles of Ag85B (B) or TB10.4 (D) specific CD8 T cells shown as triple, double, or single positive CD8 T cells. The color code for the pies is the same as shown in Fig. 1E. Dot plots, representative of five mice, are also shown in (B) and (D), depicting IFN-γ expressed by CD44+CD8+ cells after stimulation with Ag85B (B) or TB10.4 (D). (E) Cells were stimulated with Ag85B or TB10.4 in vitro for 72 hours and IFN-γ levels in supernatants were assessed by ELISA. Data represent the mean+SEM of a minimum of five mice per group with ***, p<0.001, ** and p<0.01 compared with non-vaccinated group, unless otherwise indicated (2-way ANOVA with Bonferroni posttest).

