Figure 3.
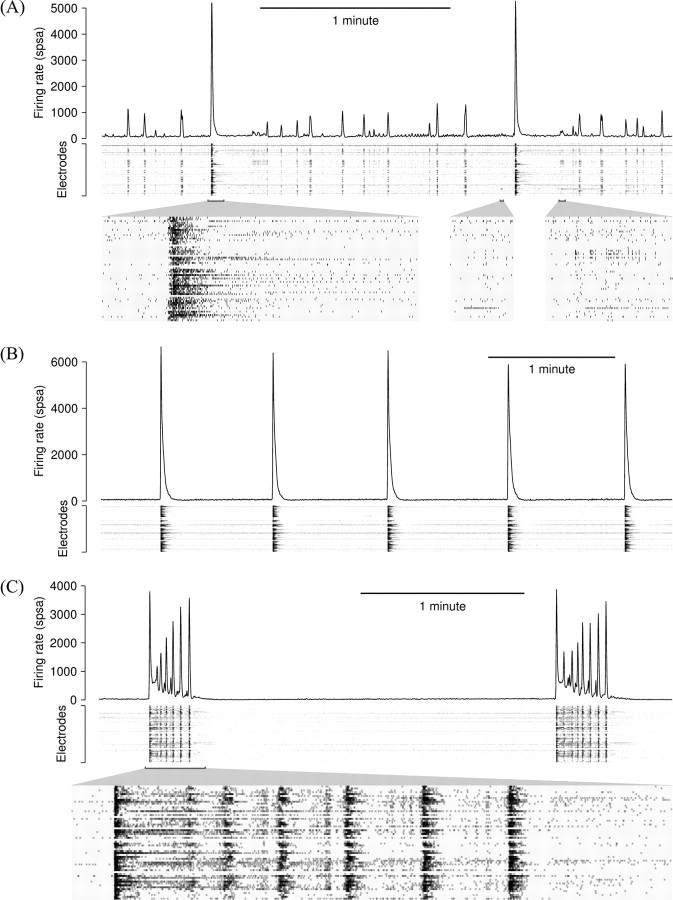
Examples of different spontaneous bursting patterns, with array-wide firing rates (line graphs) as well as per-electrode firing rates (grayscale plots). A, Chaotic bursting. Insets below show spike raster plots for a large global burst, a single-channel burst, and a small local burst, at 20× magnification (recorded at 25 DIV). B, Spontaneously regular bursting (recorded at 39 DIV). C, Superbursts (recorded at 34 DIV). The inset shows spikes at 10× magnification.

