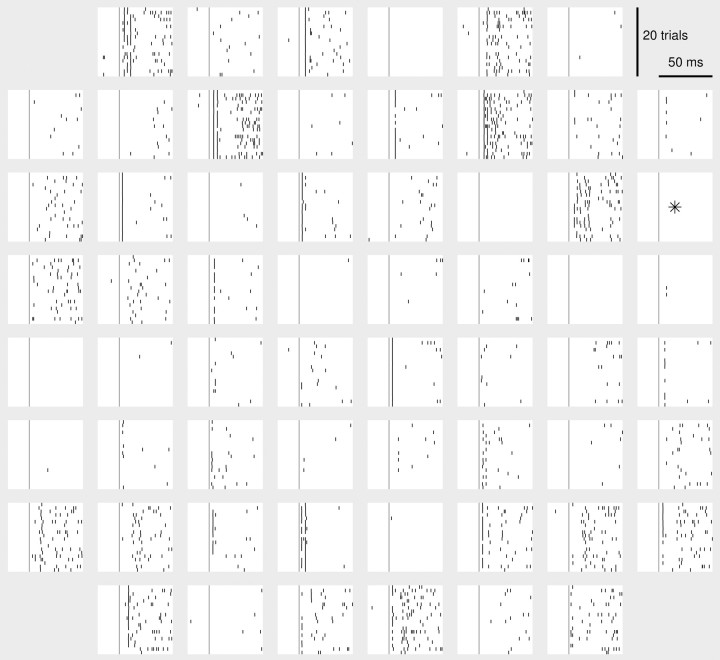
Figure 4.
Array-wide responses to stimulation. Each graph shows the responses on one electrode, represented according to the geometry of the array. The stimuli were delivered to the marked electrode. Vertical line indicates time of stimulation. Spikes were detected after artifact suppression (Wagenaar and Potter, 2002); TTX control confirmed the biological origin of all detected spikes.

