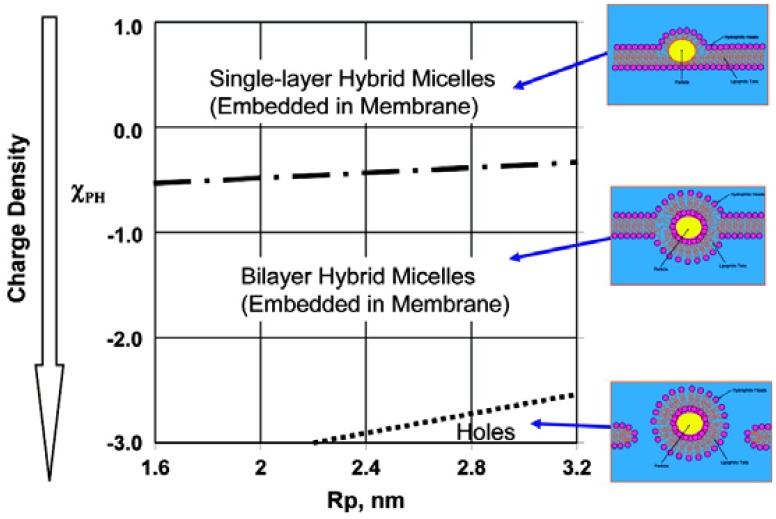
Figure 7.
Phase diagram for the morphology of membrane-nanoparticle complex as a function of particle size (RP: two-dimensional particle radius) and surface charge (χPH: Flory-Huggins interaction parameter between the particle and the headgroup). Reprinted with permission from [33]. Copyright 2007 American Chemical Society.

