Figure 1.
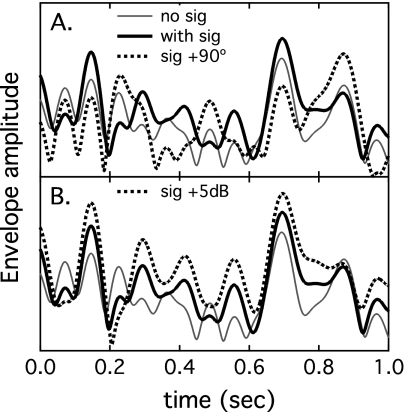
Hilbert envelopes of example stimuli are plotted as a function of time. The masker, indicated with thin gray lines in both panels, was a 15-Hz wide band of noise scaled to 50 dB SPL. The thick black lines in both panels show the envelope of that same masker sample summed with a 45-dB SPL pure tone signal at the masker center frequency. The dotted lines in each panel indicate the different envelope effects obtained by incrementing the signal starting phase by 90° [panel (A)] or incrementing the signal amplitude by 5 dB [panel (B)].

