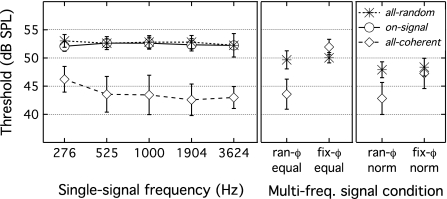
Figure 2.
Mean thresholds are plotted in dB SPL as a function of condition, with error bars showing ±1 standard deviation. Symbols reflect the masker type, either all-random (stars), on-signal (circles), or all-coherent (diamonds). The left panel shows single-frequency signal conditions, with frequency in hertz indicated on the abscissa. The middle panel shows multi-frequency signal conditions in which all signal tones were of equal amplitude. The panel on the right shows multi-frequency signal conditions in which the signal tones were presented at equal dB SL, determined separately for each observer and masker.

