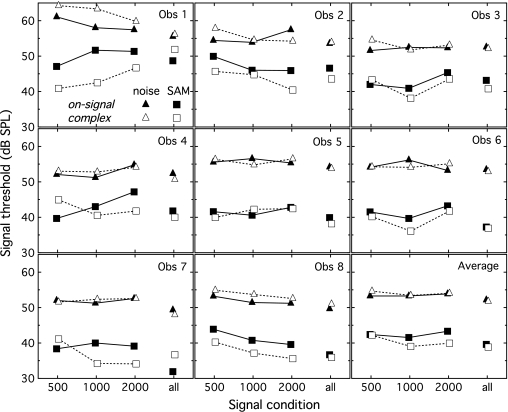
Figure 3.
Mean thresholds for individual observers are shown in each panel, as well as the mean across Obs 2–8. Thresholds are plotted in dB SPL as a function of signal condition, with thresholds in the multi-frequency signal conditions plotted relative to the most intense of the three tones normalized to single-frequency signal thresholds. Symbols indicate the masker condition, either noise (triangle) or SAM noise (square). Filled symbols indicate threshold for a pure tone in a single masker band or a complex signal where relative tone levels are normalized based on results obtained with on-signal maskers. Open symbols indicate pure tone thresholds obtained in the presence of three masker bands, as well as the associated complex signal thresholds.

