Figure 2.
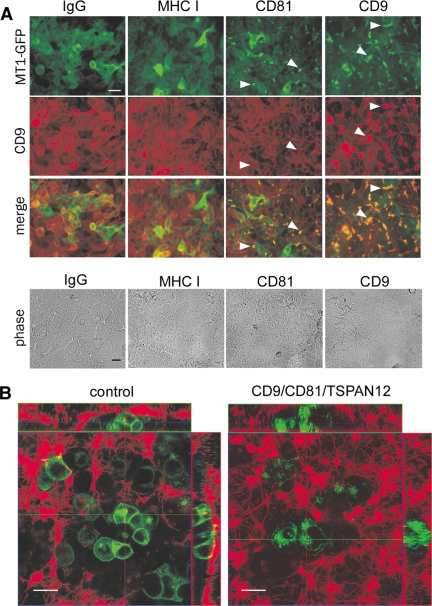
Tetraspanin effects on MT1-MMP subcellular localization. (A) MCF-7-MT1-GFP cells were treated with the indicated control (IgG and MHC I) and tetraspanin (CD9 and CD81) antibodies (50 μg/ml for 2 d), fixed (in 4% paraformaldehyde), blocked in 5% BSA/PBS, incubated at 20°C with Alexa Fluor 546-conjugated anti-CD9 antibody (ALB6), and analyzed by fluorescence or phase-contrast microscopy. Bar, 20 μm. White arrowheads indicate coclustering of MT1-MMP-GFP with CD9 or CD81. (B) MCF-7-MT1-GFP cells were transfected with control or CD9/CD81/TSPAN12 siRNAs and plated within fibrin gels 2 d after siRNA transfection. Fibrin gels were spiked with 1% Alexa 546-labeled fibrinogen before addition of thrombin to form the gel. After 2 d, cells were visualized by confocal microscopy. Green, MT1-MMP-GFP; red, fibrin matrix. Laser power was adjusted to show similar green intensities between control and tetraspanin knockdown cells. Bar, 20 μm. Horizontal (green) and vertical (red) lines within the central XY image correspond to the planes chosen for XZ (up) and YZ (right) images, respectively.

