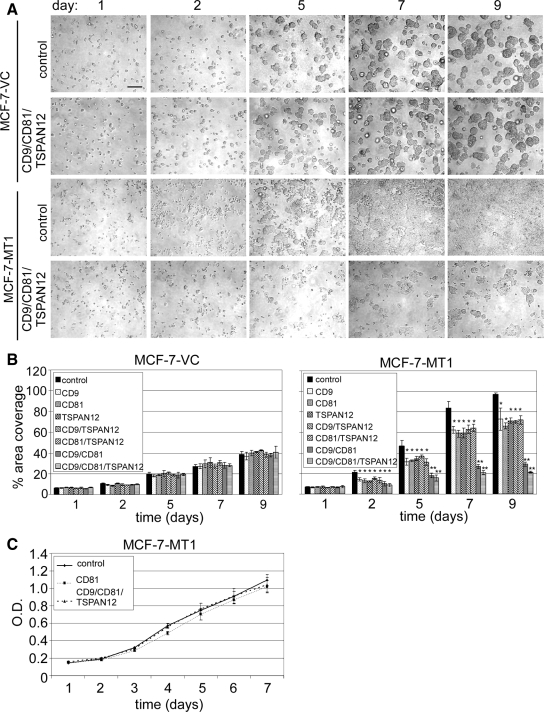
Figure 3.
Quantitation of tetraspanin effects on MT1-MMP-dependent cell growth/invasion within 3D fibrin gels. (A) MCF-7-MT1 and MCF-7-VC cells were treated for 2 d with siRNAs, and then cells were embedded within fibrin gels for the indicated times. Representative images are shown. Bar, 200 μm. (B) The percentage of area of cell coverage was determined to yield mean ± SD (n = 3; *p < 0.05, **p < 0.005 compared with control at each time point). (C) MCF-7-MT1 cells were treated with siRNAs as indicated, and then 2D growth was assessed using an MTT proliferation assay. Results are mean ± SD (n = 3).

