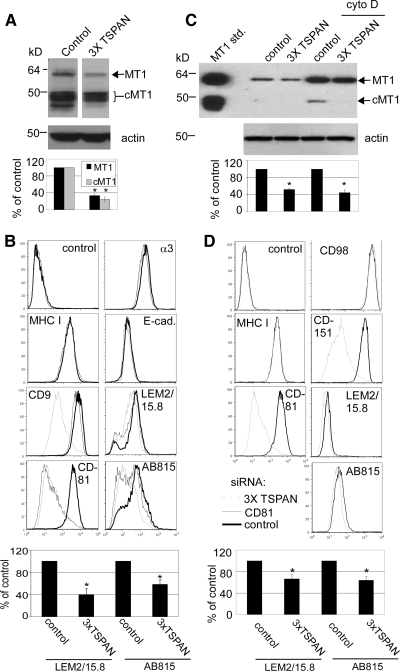
Figure 6.
Tetraspanin effects on MT1-MMP expression. (A) TX114 cell lysates from MCF-7-MT1 samples in Figure 5A were blotted for MT1-MMP (AB815 antibody) and actin. Densitometry was performed on Western blots to yield indicated percent values relative to control lanes ± SD (n = 3; *p < 0.05 compared with control); cMT1 is cleaved MT1 lacking the catalytic domain (generated via an autocatalytic cleavage event). (B) MCF-7-MT1 cells were treated with control, CD81, or CD9/CD81/TSPAN12 (3xTSPAN) siRNAs. After 4 d, cell surface expression of MHC I, E-cadherin, α3 integrin, CD9, CD81, and MT1-MMP was determined by flow cytometry. For MT1-MMP, AB815 is anti-hinge antibody (detects both full-length and cleaved MT1-MMP) and LEM2/15.8 is anti-catalytic domain antibody (detects full-length MT1-MMP only). Quantitation of flow cytometry mean fluorescent intensity (MFI) values of MT1-MMP by using either AB815 or LEM2/15.8 antibodies is shown and expressed as percentage of control ± SD (n = 4; *p < 0.05 compared with control for each antibody). (C) Cell lysates from HT1080 samples in Figure 5B were blotted for MT1-MMP (AB815 antibody) or actin. Densitometry of total MT1-MMP was expressed as percentage relative to controls ± SD (n = 3; *p < 0.01 compared with control). cMT1 is cleaved MT1-MMP. MT1-MMP standard was prepared as described in Figure 1B. (D) HT1080 cells were transfected with control or CD81/CD151/TSPAN12 (3xTSPAN) siRNAs, and flow cytometry was performed 4 d after transfection for MHC I, CD98, CD81, CD151, and MT1-MMP (AB815 and LEM2/15.8) with cyto D stimulation 1 d before flow cytometry. Quantitation of flow cytometry MFI values of MT1-MMP is shown and expressed as percentage of control ± SD (n = 5; *p < 0.05 compared with control for each antibody).

