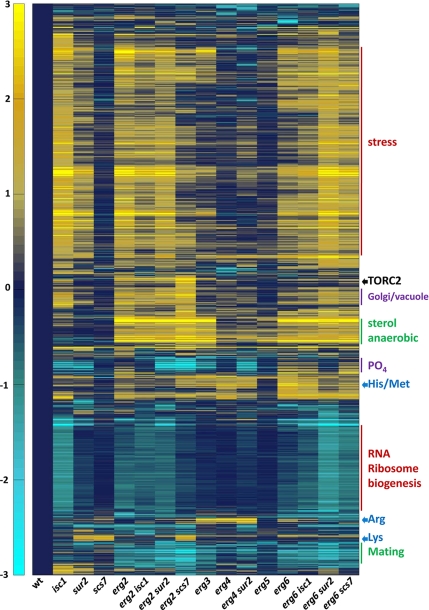
Figure 7.
Cluster map of transcripts that change in the sterol and sphingolipid mutants. Transcript levels were determined in the indicated strains. Data for transcripts that changed at least twofold under one condition were clustered. Predominant characteristics of gene clusters are indicated on the right. An expandable version of the figure with gene names or identifiers is provided (Supplementary Figure S6). The scale is a log transformed base 2.

