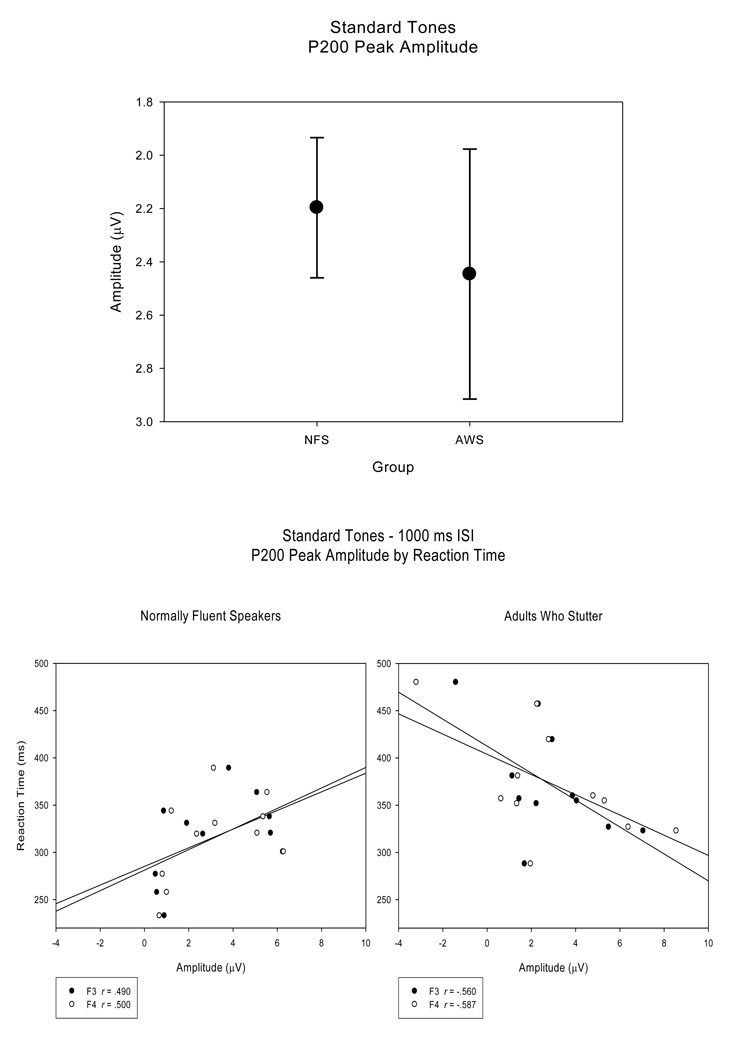
Figure 4.
N100S peak amplitudes (averaged across electrode sites) plotted for both groups (top panel) illustrate that the range of N100S peak amplitudes were larger in the AWS compared to the NFS. Regression plots for individual subjects at electrode sites F3 and F4 for the NFS and the AWS (bottom panel) illustrate the trend toward a significant correlation between tone detection accuracy and N100S peak amplitude measures in the AWS, a relationship not observed in the NFS.

