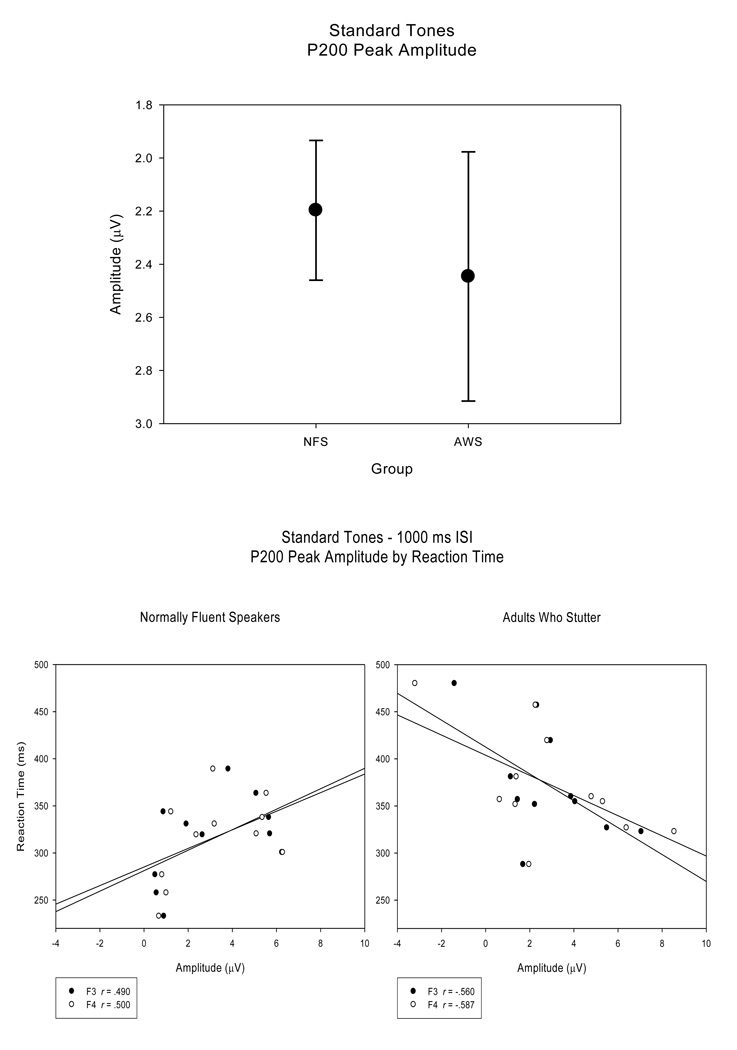
Figure 5.
P200 peak amplitudes (averaged across electrode sites) plotted for the NFS and the AWS reveal that the range of P200 peak amplitudes is larger for the AWS than for the NFS (top panel). Regression plots of P200 peak amplitude (at electrode sites F3 and F4) versus RT for the NFS and the AWS (bottom panel) illustrate the trend toward significant correlation between RT and P200 peak amplitude in the AWS, an association not found for the NFS.

