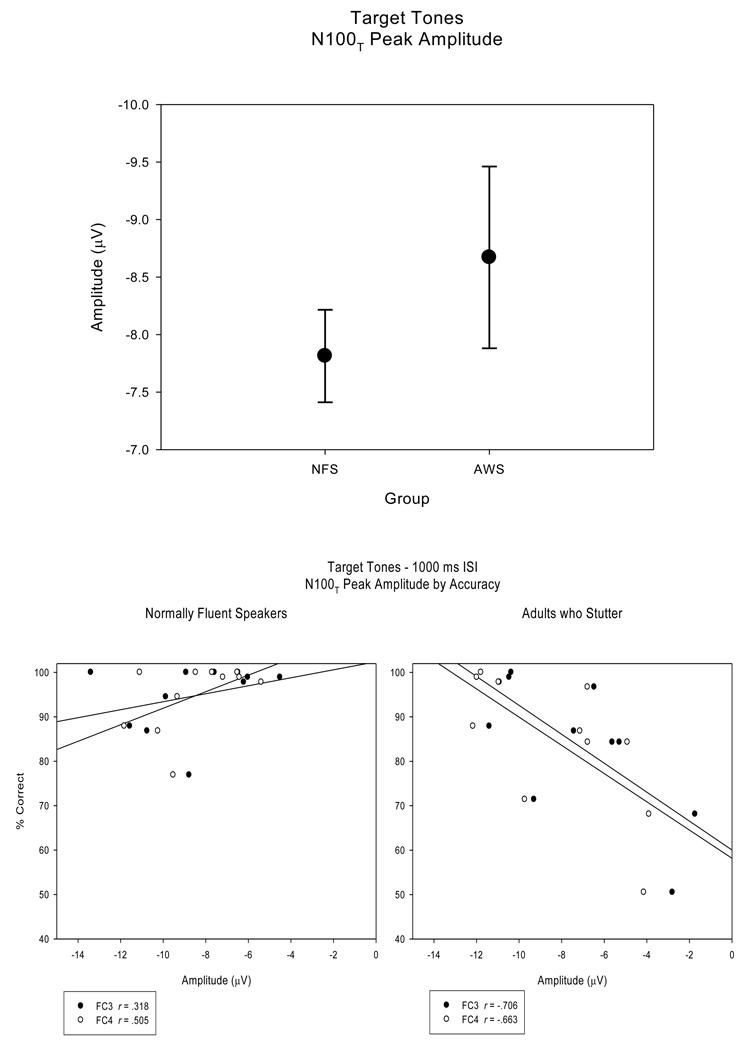
Figure 7.
N100T peak amplitudes (averaged across electrode sites) for the target tones are plotted, comparing the NFS and AWS (top panel). As illustrated, the AWS exhibited a larger range of N100T peak amplitude values. Regression plots for the NFS and the AWS (bottom panel) display a significant relationship between N100T peak amplitudes and accuracy in the AWS at electrode sites FC3 and FC4, while the correlation is not significant in the NFS.

