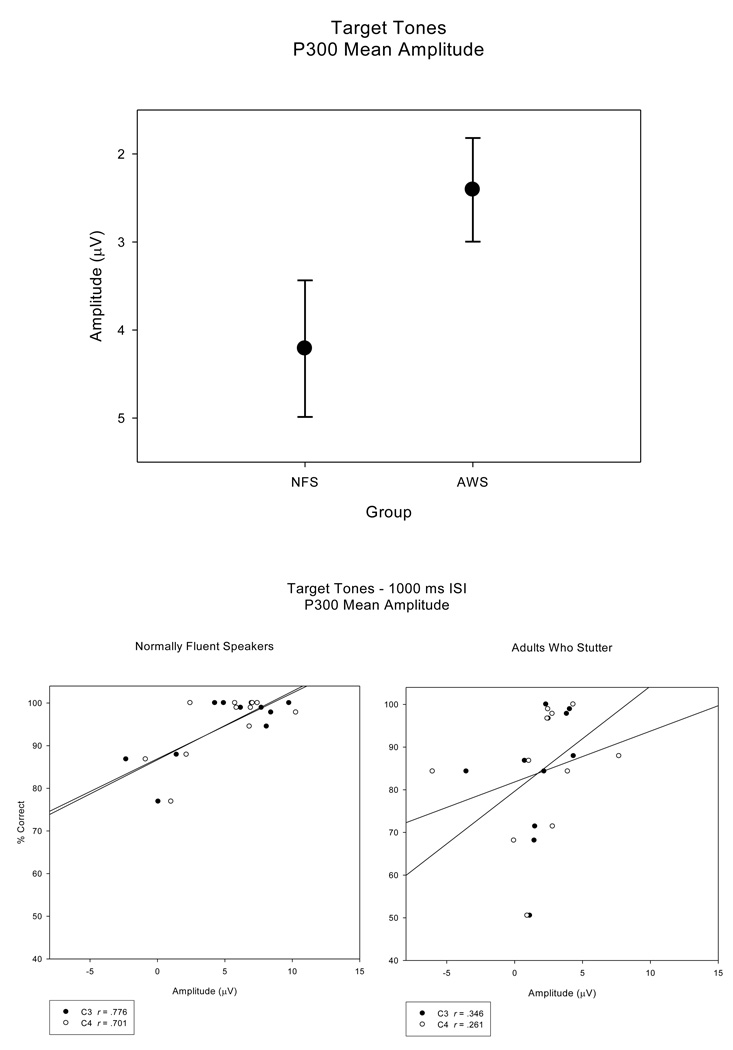
Figure 8.
P300 mean amplitudes (top panel) plotted for NFS and the AWS (averaged across electrode sites) illustrate the trend for reduced P300 mean amplitudes in the AWS. As opposed to the regression plots for the earlier potentials, the regression plots for the NFS and AWS for P300 mean amplitudes (electrode sites C3 and C4; bottom panel) illustrate a significant correlation between accuracy and P300 mean amplitude in the NFS, with no significant correlation in the AWS.

