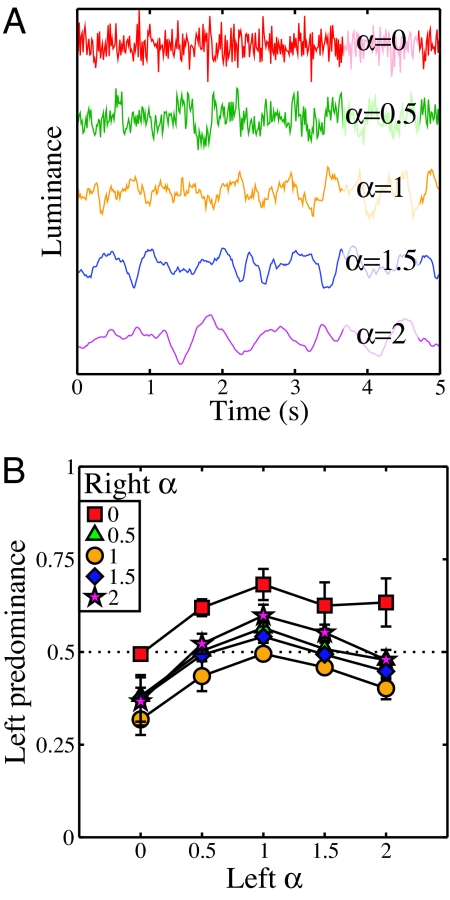
Fig. 2.
Temporal luminance profiles and results of experiment II. (A) Example luminance profiles of a single pixel at different temporal α values. The functions are displaced vertically for clarity. (B) Results for experiment II, displayed in the same format as those in Fig. 1B. Here, α gives the exponent determining the temporal amplitude spectrum.

