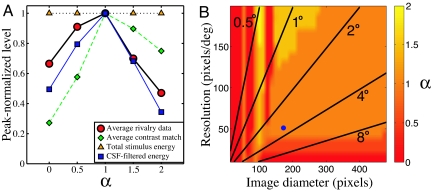
Fig. 3.
Analysis of scaling metrics for fractal noise stimuli. (A) Peak-normalized functions for (i) rivalry data from Fig. 1B averaged across condition (red circles), (ii) contrast matching data, averaged over 3 observers (green diamonds), (iii) total stimulus energy (orange triangles), and (iv) effective contrast of noise stimuli after attenuation by a model CSF (blue squares). (B) Intensity map showing the strongest α value averaged over 100 simulations of the effective contrast model (note that the peak varied across successive simulations in only a small number of cases). The blue circle corresponds to the stimulus dimensions from experiment I, and radial lines indicate stimulus size in degrees of visual angle.

