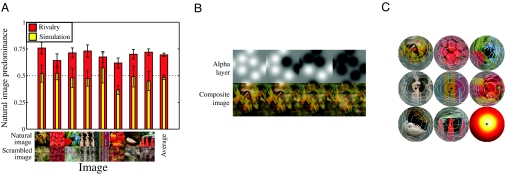
Fig. 4.
Results and example stimuli for experiment III, in which natural images rivaled with their phase-scrambled counterparts. (A) Data plotted as the proportion of time the natural image was reported as dominant during rivalry (red) and simulation (yellow) conditions, for 8 images. The average across all images is given by the bar (Right). Data are averaged across 6 observers, with error bars showing ± 1SE. In the rivalry conditions, the natural images were seen for the majority of each trial. (B) Example stimuli from the replay condition—the alpha layer (Upper) determines transparency of the natural image. As the Gaussians comprising the alpha layer were varied over time, they produced a range of composite images, as shown (Lower). (C) Correlation maps show how the state of each pixel (natural or scrambled image) is predictive of observer responses (average of 6 observers). The contrast of each pixel is scaled in proportion to its correlation coefficient (r), and contours enclose the 10th-, 30th-, 50th-, 70th-, and 90th-percentile r values. The lower right circle is an intensity map of r averaged across all 8 images.

