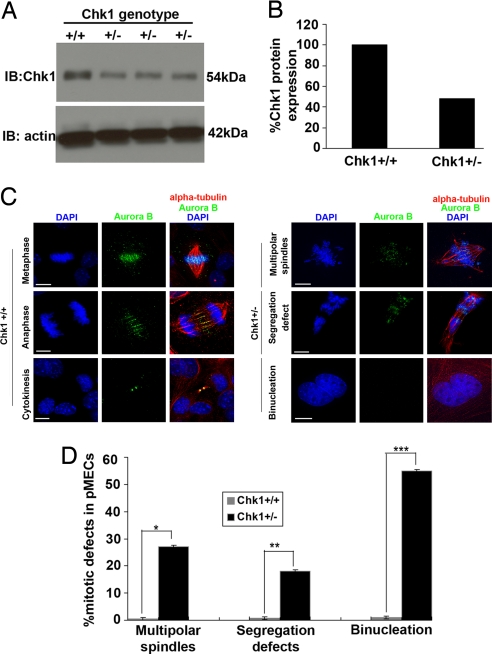
Fig. 1.
Chk1+/− mice display multiple mitotic defects and increased binucleation. (A and B) Western blot analysis of whole mammary-gland extract from Chk1+/− (n = 4) mice shows 48% of Chk1(anti-Chk1(G4)) expression relative to Chk1+/+ mice. β-actin was used as loading control. (C) Merged images of Chk1+/+ pMECs undergoing mitosis and cytokinesis or Chk1+/− pMECs undergoing various mitotic defects were stained for Aurora B (green), alpha-tubulin (red), and DNA (DAPI blue). (D) Bar graph illustrates that 18% of Chk1+/− pMECs (n = 88) displayed multiple mitotic defects and 55% of Chk1+/− pMECs were binucleated as compared with Chk1+/+ pMECs. ∗, P = 0.001; ∗∗, P = 0.001; and ∗∗∗, P = 0.03. All images have 15 micron scale bars at 63× magnification.

