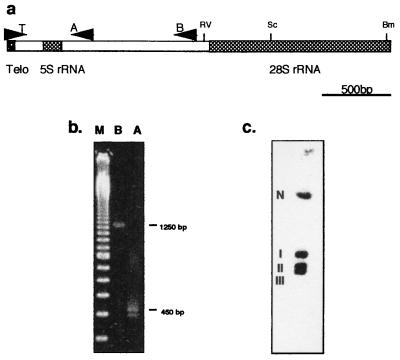
Figure 2.
Mapping G. theta telomeres. (a) Graphic representation of the telomere-containing end of nucleomorph chromosomes. rRNA genes are shaded and restriction sites are marked (RV, EcoRV; Sc, SacI; Bm, BamHI). Primers used in PCRs are represented by lettered arrows (T, A, and B). (b) Resolution of PCR-amplification products obtained by using primers T/A (A) and T/B (B). Markers (M) are a 1-kb ladder. (c) Southern analysis of total G. theta DNA resolved by pulse-field gel electrophoresis and hybridized with a telomere probe. The positions of nuclear (N) and nucleomorph chromosomes (I, II, and III) are shown.

