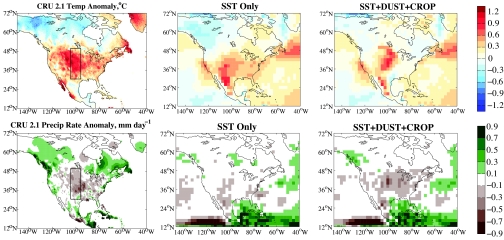
Fig. 1.
Temperature (°C) and precipitation (mm day−1) anomalies for the Dust Bowl drought from the Climate Research Unit (CRU) version 2.1 dataset (11) and 2 of our model experiments: SST-ONLY (our control) and SST+DUST+CROP (full land degradation in the form of a Great Plains dust aerosol source and crop removal). The CRU data are composed of monthly climate grids for the world, statistically interpolated from station observations to continuous 0.5° spatial resolution. Model grid spacing is ≈2° × 2.5°. Anomalies are for the period 1932–1939, relative to the 1920–1929 observed average (for CRU data) or an ensemble average from a 5-member ensemble run using observed SSTs for 1920–1929 (for the model plots). The block rectangle in the CRU plot surrounds the Great Plains region (105°E–95°E and 30°N–50°N), used to calculate spatially averaged anomalies for Fig. 3.

