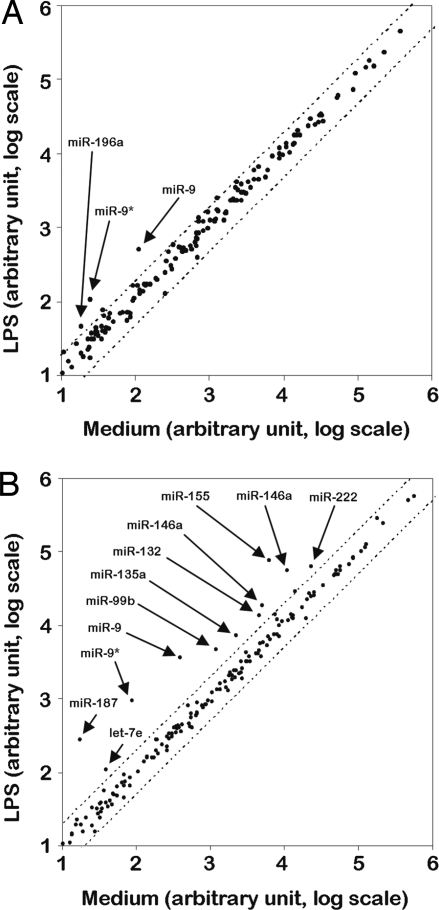
Fig. 1.
miRNAs induced by LPS in PMN and monocytes. PMN (A) and autologous monocytes (B) were cultured for 8 h in medium alone or in the presence of 100 ng/ml LPS. The miRNA fraction was purified and changes in miRNA expression levels were determined using a micro fluidic card as described in Materials and Methods. Results are expressed as arbitrary units on a log scale using RNU44 as reference control. The mean values of 2 individual experiments performed are shown. Dotted lines represent the 2 and 0.5 boundary values for fold induction.

