Fig. 1.
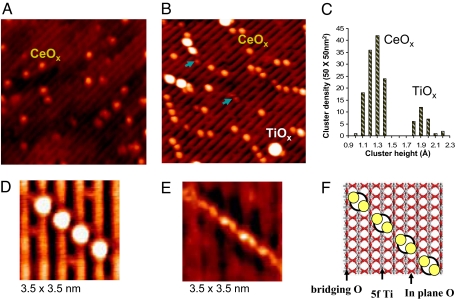
STM results illustrating morphological changes of CeOx on the TiO2(110) surface. (A) STM image (15 × 15 nm) taken after depositing Ce atoms at 298 K in UHV (Vt = 1.3 V and It = 0.05 nA). (B) STM image (15 × 15 nm) acquired after depositing Ce atoms at 600 K and subsequent annealing at 900 K in O2 (PO2 ≈1 × 10⁻⁷ Torr) (Vt = 1.2 V and It = 0.07 nA). (C) Height distribution for the spots seen in B. (D and E) Zoomed-in STM images (3.5 × 3.5 nm) of a diagonal array of CeOx taken at different imaging condition of 1.2 V, 0.06 nA and 0.4 V, 0.06 nA, respectively. (F) Model showing possible orientations for the bright protrusions of CeOx in D and E. The dimers of ceria are shown as a combination of white and yellow spheres.

