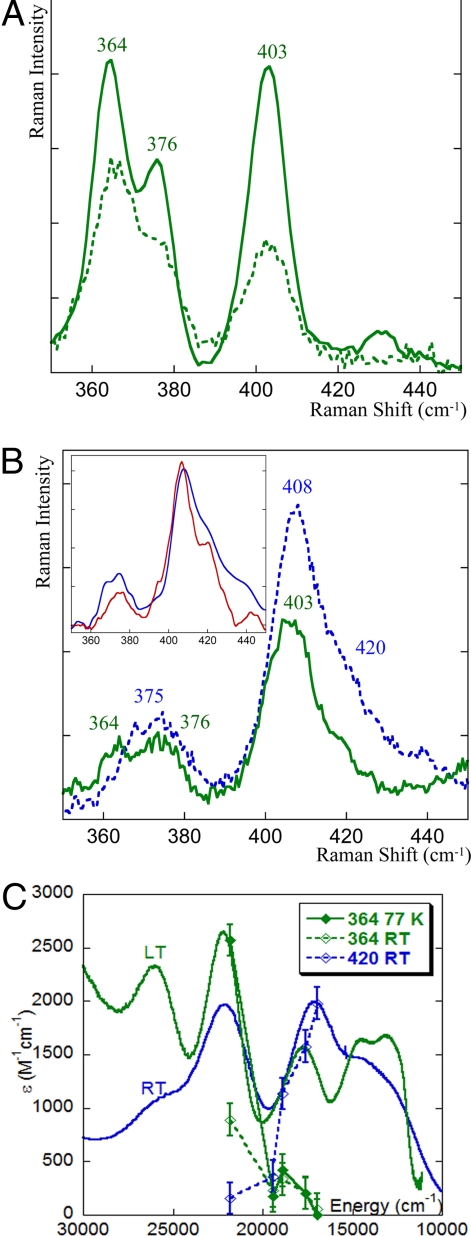
Fig. 2.
Resonance Raman spectra of resting WT NiR excited at 458 nm (A)and 568 nm (B). Data for 77 K are in bold lines and for 25 °C are in dotted lines. (Inset) Resonance Raman spectrum of the pure blue component of NiR (blue spectrum, obtained by subtracting the spectrum of the green species at 77 K, 568 nm from the 25 °C, 568-nm spectrum and renormalization) and of the M182T variant of NiR (red spectrum). (C) Resonance Raman profiles overlaid with the absorption spectra. The 364 cm−1 peak is associated with the green copper species, whereas the 420 cm−1 peak reflects the blue copper component of NiR.

