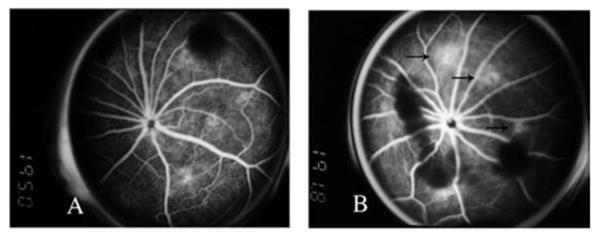
FIGURE 9.

The fluorescein angiography. The left panel (A) shows the fluorescein angiograph at week 2 from an eye treated with IMS2186, demonstrating a lack of active leaking, while the right panel (B), at the similar timeframe, from an eye treated with PBS, demonstrated active leaking (arrows).
