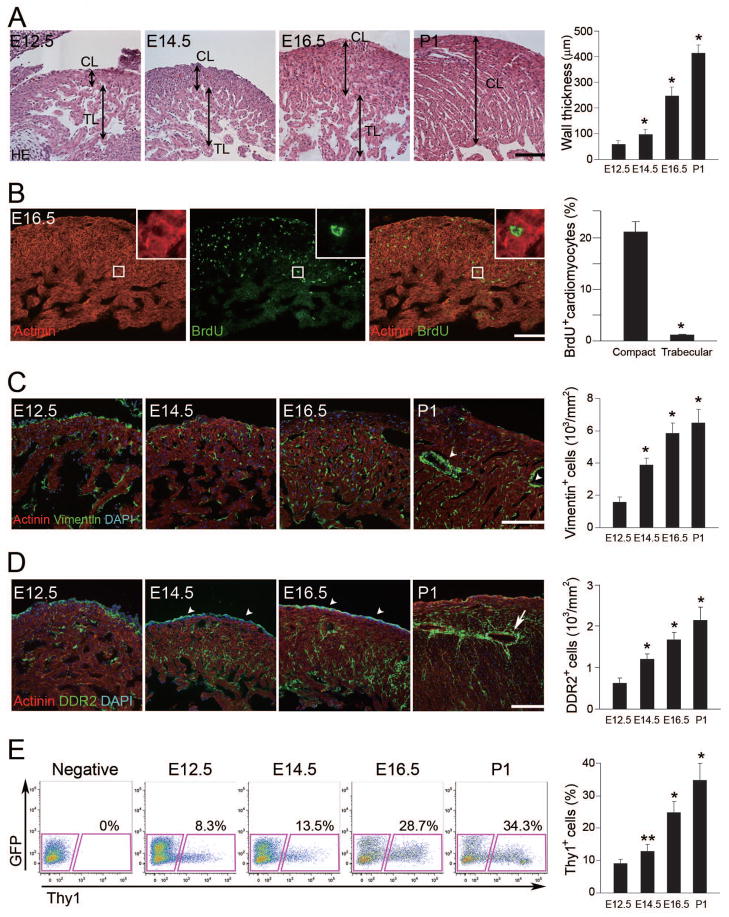
Figure 1. Cardiac Fibroblasts Develop Concordantly with Ventricular Compaction.
(A) Sections of left ventricles stained with HE. TL, trabecular layer; CL, compact layer. Quantitative analyses of wall thickness in the compact layer (n = 4). (B) Immunofluorescent staining for actinin (red) and BrdU (green). BrdU+ cells were more abundant in the compact layer than in the trabecular layer. Inset is a high-magnification view. Quantitative analyses were shown (n = 4). (C) Immunofluorescent staining for actinin (red), vimentin (green) and DAPI (blue, nuclei). Vimentin+ cells appeared in the myocardium by E12.5 and gradually increased over time. Note that vimentin+ cells existed around vessels in P1 heart (arrowheads), indicating perivascular fibroblasts. Vimentin+ cell numbers in the left ventricles (n = 4). (D) Development of DDR2+ cells (green) throughout the myocardium. Arrowheads indicate DDR2+ epicardium, and an arrow indicates perivascular fibroblasts. DDR2+ cell numbers in the left ventricles (n = 4). (E) FACS analyses for Thy1+ cells. Thy1+ cells were increased during development (n = 3). Representative data are shown in each panel. All data are presented as means ± SEM. *, P<0.01; **, P<0.05 vs relative control. Scale bars, 100 μm.

