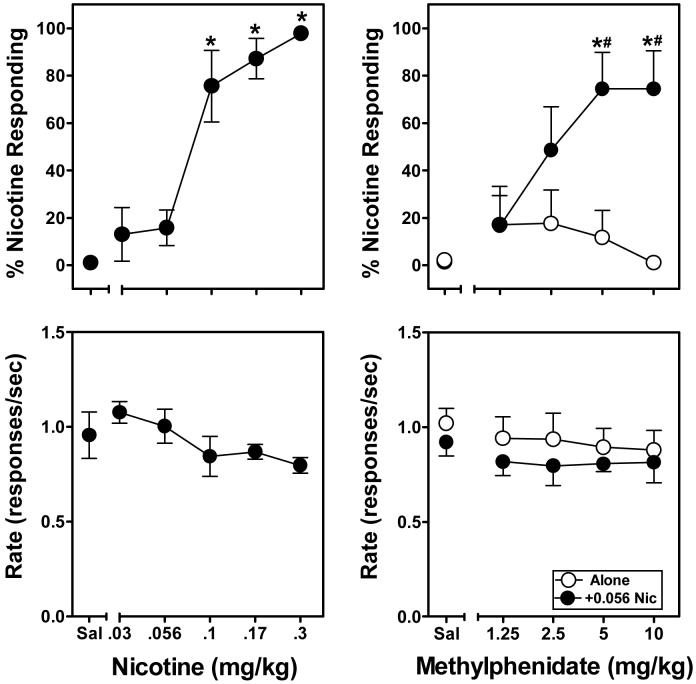
Figure 3.
Discriminative stimulus and rate effects of nicotine (0.03-0.3 mg/kg, left panel) and methylphenidate (1.25-10 mg/kg, right panel) in rats (n=6) trained to discriminate nicotine (0.3 mg/kg) from saline. Data points in the upper panels represent the mean (±SEM) percentage of responses occurring on the nicotine-appropriate lever as a function of dose, whereas data points in the lower panels represent the mean (±SEM) rate of responding (responses per sec) as a function of dose. Asterisks indicate a significant difference from the saline (Sal) control values (*p<.01). Hache symbols indicate a significant difference relative to the same methylphenidate dose given alone (#p<.05).

