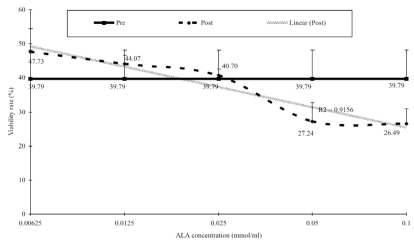
Figure 2.
Dose response curve of ALA against sperm vitality. Sperm vitality was assessed using light microscope with Mtrack J Imaging System on the Weber sterility chamber. Mann-Whitney t-test was used to determine the differences between baseline (pre) and after one-hour incubation (post). There is no significant differences between pre and post treatment (P>0.05). r2 = 0.9156 N=31

