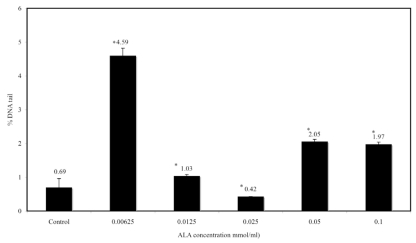
Figure 3.
Percentage of tail DNA (N=31) against a range of ALA concentration (0, 0.00625, 0.0125, 0.025, 0.05 and 0.1mmol/ml). Percentage of tail DNA was done using Comet assay imaging software (CASP version 2). Kruskal Wallis ANOVA was used to determine significant differences between ALA concentrations and percentage of DNA tail. There is a significant differences between the range of concentration compared to control group. *P<0.05

