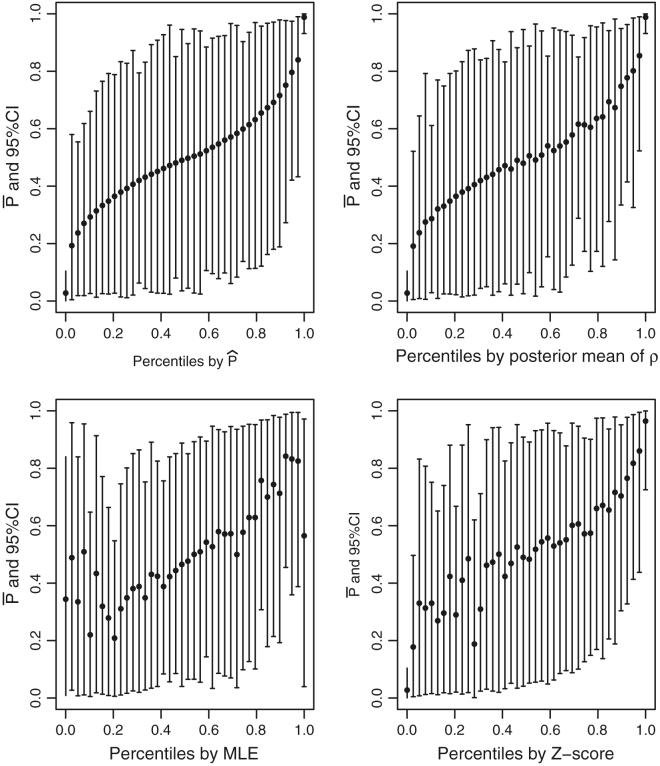
Fig. 4.
SEL-based percentiles for 1998. For each display, the Y-axis is 100 × with its 95% probability interval. The X-axis for the upper left panel is , for the upper right is percentiles based on ρpm, for the lower left is percentiles based on the ρmle and for the lower right is percentiles based on Z-scores testing ρk = 1

