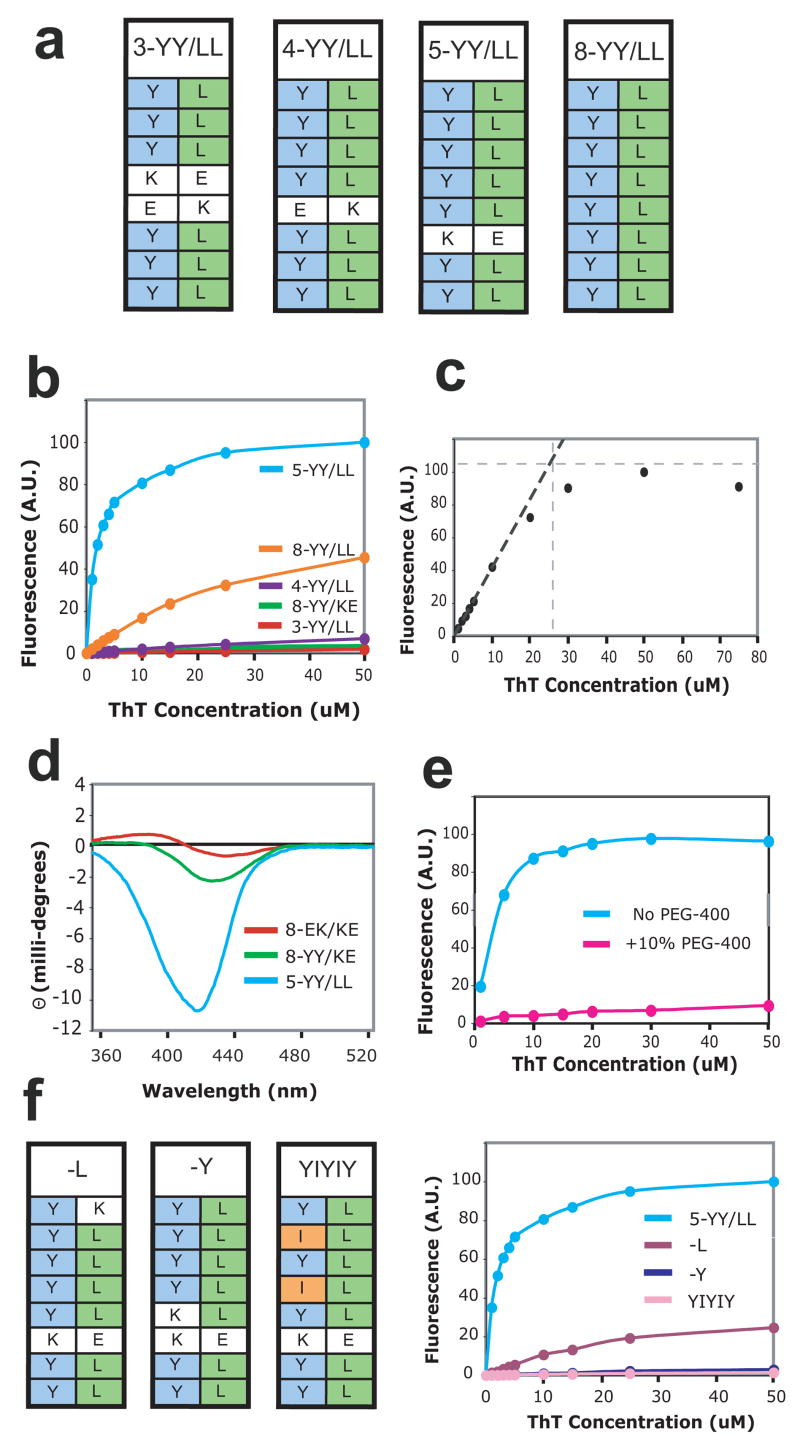
Figure 3.

Design of side-by-side ladders and their ThT binding. (a) Schemes of the side-by-side ladders used in this work. (b) ThT binding titrations measuring ThT fluorescence emission at 485 nm. Protein concentrations were 10 μM. (c) Determination of the stoichiometry of ThT binding to the PSAM by binding site titration. ThT fluorescence emission intensity at 485 nm is plotted as a function of ThT concentration. The binding titration was performed with 25 μM 5-YY/LL PSAM, i.e. a protein concentration much higher than the Kd of the binding reaction. Extrapolation of the linear portion of the curve near the origin is shown as the black dashed line. The gray horizontal dashed line is a saturation value of ThT fluorescence estimated at ~110 A.U. The intercept of the two lines indicates that the saturating ThT concentration is ~25 μM, i.e. a 1:1 binding stoichiometry between ThT and the PSAM. (d) CD spectra of 0.5 mM ThT in the presence of 0.5 mM of the PSAM variants. (e) Crystallization conditions impede observation of bound ThT. ThT binding titrations to 10 μM 5-YY/LL in the presence (pink) and absence (blue) of 10% v/v PEG-400. Note that a 40% v/v PEG-400 solution was used in crystallization. (f) Schemes of point mutants of 5-YY/LL, termed –Y, –L, and YIYIY. On the right are shown ThT binding titrations of these mutants, measured as described in (b).
